Landkreis Emsland
Internetpräsentation
Version 2.2.12
Ergebnis zur Bundestagswahl 2017 am 24.09.2017
Wahlkreis Mittelems - Landkreis Grafschaft Bentheim - Samtgemeinde Neuenhaus - Stadt Neuenhaus
Es wurden alle Wahlbezirke ausgewertet.
 Diagramm
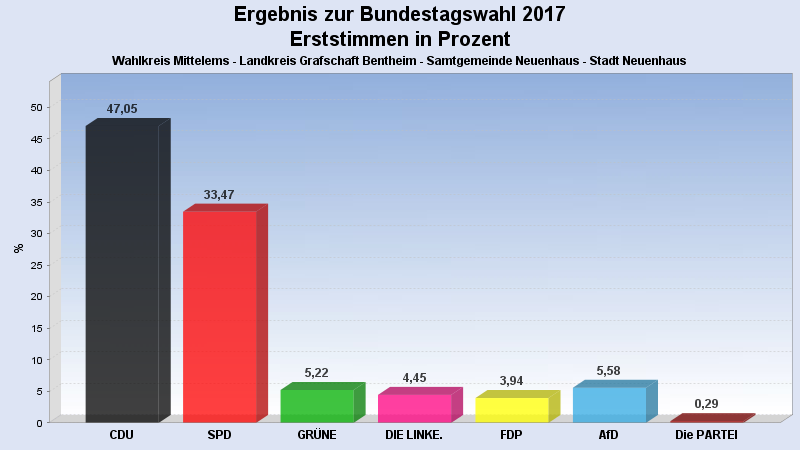
 Seitenanfang
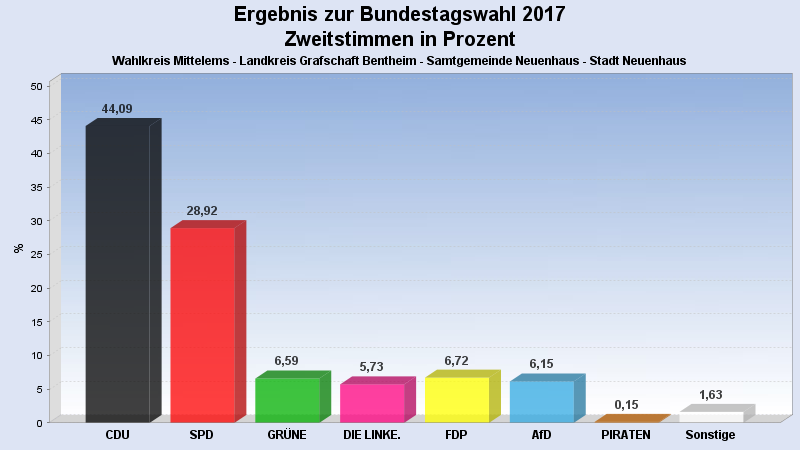
Wahlbeteiligung, Stimmzettel, Stimmen
| Wahlbeteiligung: | 64,33% |
|---|---|
| Wahlberechtigte: | 7.093 |
| Wähler: | 4.563 |
| Ungültige Erststimmen: | 25 |
| Gültige Erststimmen: | 4.538 |
| Ungültige Zweitstimmen: | 27 |
| Gültige Zweitstimmen: | 4.536 |
Erststimmen nach Wahlvorschlag
| Partei | Erststimmen | Prozent | |
|---|---|---|---|
| 1 | Stegemann, Albert (CDU) | 2.135 | 47,05% |
| 2 | Dr. De Ridder, Daniela (SPD) | 1.519 | 33,47% |
| 3 | Prüllage, Reinhard (GRÜNE) | 237 | 5,22% |
| 4 | Linguari, Roberto (DIE LINKE.) | 202 | 4,45% |
| 5 | Beeck, Jens (FDP) | 179 | 3,94% |
| 6 | Meiners, Danny (AfD) | 253 | 5,58% |
| 17 | Nützel, Harald (Die PARTEI) | 13 | 0,29% |
Zweitstimmen nach Wahlvorschlag
| Partei | Zweitstimmen | Prozent | |
|---|---|---|---|
| 1 | CDU | 2.000 | 44,09% |
| 2 | SPD | 1.312 | 28,92% |
| 3 | GRÜNE | 299 | 6,59% |
| 4 | DIE LINKE. | 260 | 5,73% |
| 5 | FDP | 305 | 6,72% |
| 6 | AfD | 279 | 6,15% |
| 7 | PIRATEN | 7 | 0,15% |
| 8 | NPD | 4 | 0,09% |
| 9 | Tierschutzpartei | 28 | 0,62% |
| 10 | FREIE WÄHLER | 1 | 0,02% |
| 11 | MLPD | 0 | 0,00% |
| 12 | BGE | 1 | 0,02% |
| 13 | DiB | 5 | 0,11% |
| 14 | DKP | 2 | 0,04% |
| 15 | DM | 5 | 0,11% |
| 16 | ÖDP | 6 | 0,13% |
| 17 | Die PARTEI | 18 | 0,40% |
| 18 | V-Partei³ | 4 | 0,09% |
- Stand: 28.09.2017 15:56:59